AI Council — Agent 1 of 8
Performance Analyst
Profitability & statistical edge
Your PnL can look fine while your edge is already dying. The Performance Analyst catches statistical deterioration weeks before the equity curve confirms it.
The quantitative backbone of AI Council. It reads pre-computed portfolio metrics — Sharpe/Sortino/Calmar, R-multiple distribution, rolling-window expectancy, streak stability, per-setup breakdown, and your personal historical baseline — then grades whether your edge is stable, improving, or silently decaying.
What the Performance Analyst actually outputs
Not a chat summary — a structured forensic report from your canonical trade tape, with grades, benchmarks, and prioritized recommendations.
Sample Performance Analyst report
Illustrative output from a populated audit — same structure as the in-app agent renderer.
Performance Analyst's Assessment
Headline metrics still look acceptable, but rolling-window analysis shows edge decay: second-half expectancy fell 60% vs. first half while loss streaks lengthened. Two setups carry positive R; one is statistical noise.
Benchmark analysis
What you're doing well
Gross profits still exceed gross losses — edge has not fully collapsed yet.
Breakout Retest carries positive expectancy across 24 trades in the audit window.
Areas needing attention
Second-half expectancy dropped 60% vs. first half — classic pre-drawdown signal.
Average loss streak length increased from 2.1 to 3.4 trades — variance spike.
Recommended actions
Reduce size on Pullback Long until rolling expectancy stabilizes above $0 for 20 trades.
Expected impact: Stops compounding a decaying setup while preserving capital on Breakout Retest.
Compare current period vs. personal baseline — expectancy is −$28/trade below your historical norm.
Expected impact: Confirms this is deterioration, not normal variance.
What it reads from your tape
The Performance Analyst receives pre-aggregated metrics from your completed trades — not a generic chat summary. Every input comes from your canonical trade tape.
- →Win rate, profit factor, Sharpe/Sortino/Calmar ratios
- →Rolling-window expectancy and first-half vs. second-half deltas
- →Equity curve slope, new highs, and drawdown recovery status
- →Win/loss streak stability and loss-cluster score
- →Per-setup expectancy (Playbook setups with 3+ trades)
- →Personal baseline comparison vs. up to 200 prior trades
What it detects
- Expectancy collapse across rolling windows and period halves
- Streak instability — lengthening loss clusters after win streaks
- Win-rate distortion masking negative expectancy or declining avg R
- Edge inconsistency between recent and older periods vs. your baseline
What it delivers
- Performance grade, consistency score, and edge trend label
- Profitability diagnostics with strengths and weaknesses
- Per-setup expectancy ranking and period decomposition
- Statistical deterioration warnings with pre-computed evidence
See if your edge is decaying — before your PnL chart shows it
Run the Performance Analyst on your completed trades. Inspect the full AI Council free on a populated demo account — read-only, no credit card.
Example finding
“Second-half expectancy −$42/trade vs. first half (+$18); avg R dropped 0.31R; loss streaks lengthened from 2.1 to 3.4 trades — edge decaying while win rate held at 54%.”
How it fits the Council
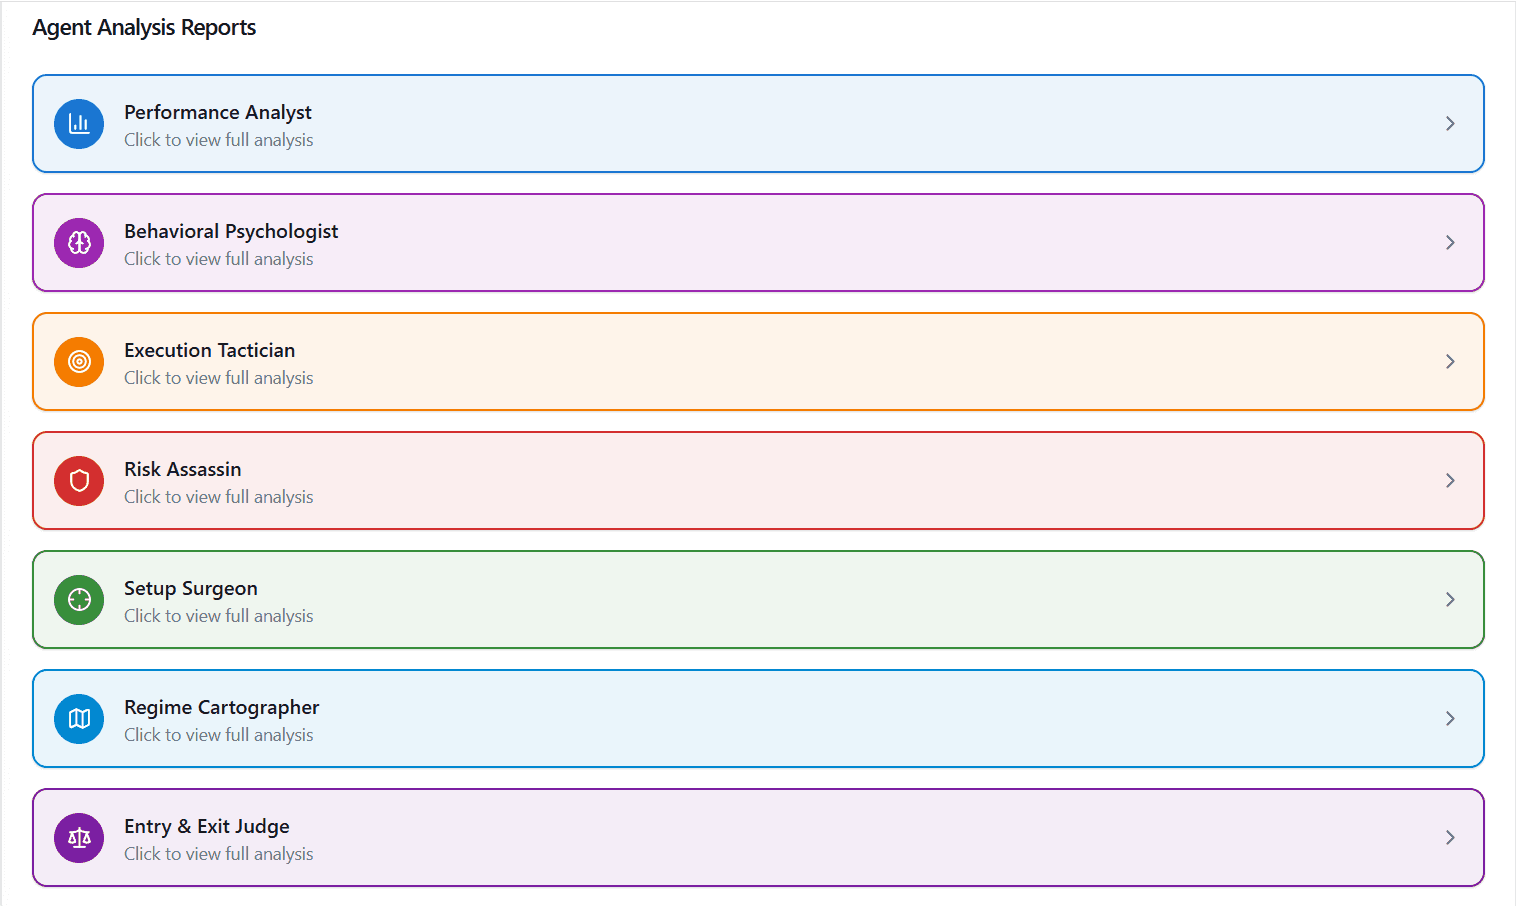
The Performance Analyst runs in parallel with six other specialists on the same audit period. Each agent sees metrics tuned to its domain. When specialists disagree, they debate transparently in The Situation Room before the Chief Coaching Officer synthesizes everything into a dollar-ranked Kill List.
- 1Seven specialists analyze pre-computed metrics in parallel
- 2Disagreements surface in The Situation Room debate transcript
- 3Chief Coaching Officer ranks preventable leakage into your Kill List ($/month)
Meet the other agents
Behavioral Psychologist
Discipline & emotional leakage
Meet Behavioral Psychologist Agent 3Execution Tactician
Timing & fill quality
Meet Execution Tactician Agent 4Risk Assassin
Capital preservation
Meet Risk Assassin Agent 5Setup Surgeon
Setup edge & decay
Meet Setup Surgeon Agent 6Regime Cartographer
Market environment fit
Meet Regime Cartographer Agent 7Entry & Exit Judge
Opportunity capture forensics
Meet Entry & Exit Judge Agent 8Chief Coaching Officer
Synthesis & prioritization
Meet Chief Coaching OfficerFrequently asked questions
Frequently asked questions
What makes the Performance Analyst different from a PnL chart?
PnL shows outcomes after the fact. The Performance Analyst decomposes rolling-window expectancy, R-multiple distribution, streak stability, and first-half vs. second-half deltas to detect edge decay before headline numbers turn negative. It also compares your current period against your personal historical baseline when prior trades exist.
Does it analyze each setup separately?
Yes. Per-setup expectancy is computed for Playbook setups with at least 3 completed trades in the audit window — win rate, avg R, and dollar expectancy per setup. The agent cites these when diagnosing which strategies still carry edge.
How is this different from the Setup Surgeon?
The Performance Analyst measures aggregate and per-setup profitability statistics — expectancy, R distribution, streaks, and baseline comparison. The Setup Surgeon goes deeper on setup DNA: parameter drift, compliance rates, regime dependency, and dead-setup classification. They complement each other; the CCO synthesizes both into the Kill List.
How many trades do I need for a meaningful audit?
Core ratios work from day one. Rolling-window and half-period comparisons require at least 6 completed trades. Per-setup breakdowns need 3+ trades per setup. Personal baseline comparison uses up to 200 trades before your selected audit window.
Does my trade data train AI models?
No. Your trade tape is analyzed for your audit only. Metrics are pre-computed in your account; the agent interprets those numbers — it does not recalculate from raw chat input.
See Performance Analyst on your trade history
Inspect the full AI Council on a populated account — every agent visible, read-only, no credit card.